
Improving SNR by pixel binning

Introduction
When selecting between different spectrometer configurations for a project, several factors must be evaluated. In most cases, three performance characteristics dominate the decision:
- Throughput – how much light the system can collect
- Spectral resolution – how closely spaced spectral features can be distinguished
- Signal‑to‑noise ratio (SNR) – how small changes in signal intensity can be reliably detected
Two components strongly influence these characteristics: the slit width and the detector array. The slit width directly determines the achievable spectral resolution by defining the size of the slit image on the detector. It also affects the overall throughput, since it limits how much light can enter the spectrometer. The detector’s pixel design and sampling properties, in turn, shape the achievable signal‑to‑noise ratio.
Ideally, the detector should have a pixel pitch that is 2–3 times smaller than the full width at half maximum (FWHM) of the spectral resolution of the spectrometer’s optics. This ensures proper sampling of the spectral line spread function – consistent with the principles of Nyquist sampling. However, commercially available detectors do not always match this ideal, and other system requirements may impose constraints. As a result, many spectrometers operate in an oversampled regime.
In this application note, we demonstrate how SNR can be improved in oversampled spectrometers through the use of pixel binning. We will also show how binning affects the spectral resolution. The following guidelines apply to any spectrometer offering multiple slit options and can be used to optimize system performance for a given application.
Spectrometer slit width
Spectral resolution in a spectrometer is fundamentally defined by its ability to distinguish two closely spaced spectral peaks. This is an optical property determined by the instrument design and not by the detector pixel size. The entrance slit plays a central role in this performance. A wider slit increases throughput because a wider slit allows more light into the system. However, the slit width also determines the size of the slit image projected onto the detector, directly influencing the achievable spectral resolution. For optimal performance, the slit should be chosen as wide as possible while still meeting the required resolution, balancing signal strength and resolving power.
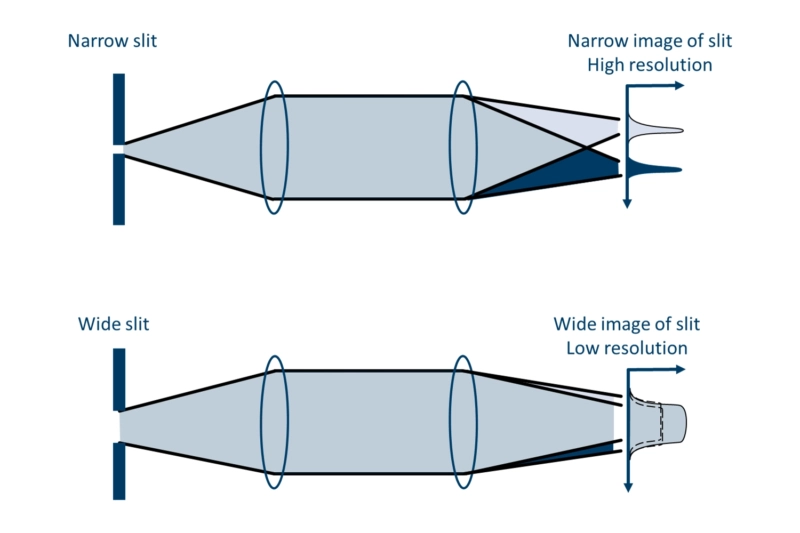
Figure 1: The width of the entrance slit determines the spectral resolution of the spectrometer.
Detector selection
The detector converts incident photons (light energy) into electronic charge. This conversion process is inherently noisy with several fundamental noise sources contributing to the final signal. Some of these noise sources scale with the signal level, while others are independent of it. When the signal is relatively strong, photon shot noise becomes the dominant contributor. In this regime, the signal to noise ratio (SNR) is proportional to the square root of the number of detected photons. Consequently, the maximum achievable SNR is limited by the detector’s full well capacity, and is approximately equal to the square root of the well depth measured in electrons. When the signal level is very low, the noise is dominated by read noise, which is independent of the signal, and by shot noise from the dark current, which increases with integration time.
SNR versus pixel size
As described above, the maximum achievable SNR is fundamentally limited by the detector’s well depth. In general, larger pixels can store more charge, so well depth typically increases with pixel size. Consequently, achieving high SNR usually favors detector arrays with the largest practical pixel dimensions.
However, in some detector families the manufacturer may impose an artificial limit on the well depth, independent of pixel size. In such cases, all detectors in the family share the same maximum SNR, even if their pixel dimensions differ. When operated below saturation, the larger pixels will still provide better SNR than smaller pixels because they collect more photons for the same exposure conditions.
Resolution versus pixel size
Besides the requirement for SNR, the detector must also be chosen to sample the resolution appropriately. Ideally, the detector pixel width should be 2–3 times smaller than the FWHM of the optical resolution peak to ensure proper sampling without loss of information. In practice, commercially available detector arrays do not always offer pixel sizes that match this exact ratio. When this occurs, the recommended approach is to select a detector with smaller pixels – effectively oversampling the optical spot – and then apply pixel binning to achieve the desired signal‑to‑noise ratio and data format.
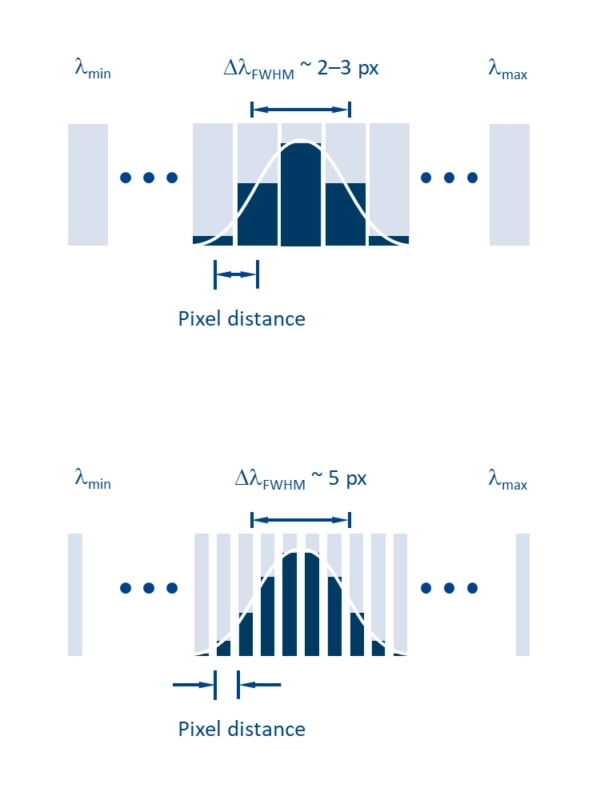
Figure 2: Upper illustration: The pixel distance is chosen optimally such that 2 – 3 pixels cover the FWHM of the spectral resolution peak. Lower: illustration: Oversampling the resolution peak
Throughput versus slit width
Figure 3 illustrates how the slit image appears on the detector for a monochromatic wave as the slit width is gradually increased from 3 pixels to 12 pixels. As expected, the image broadens, but the peak amplitude per pixel eventually plateaus and no longer increases once the slit becomes sufficiently wide.
The throughput at each wavelength corresponds to the total signal contained in the profile, so – as expected – it continues to rise with increasing slit width. However, the signal level in each individual pixel does not increase. This means the achievable per‑pixel SNR does not improve at larger slit widths, which can seem counterintuitive.
To gain the SNR benefit from the increased throughput achieved by widening the slit, the signal from adjacent pixels must be combined. This process, known as binning, can – when the bin size is chosen appropriately – be performed without any loss of spectral resolution, as described in the next section.
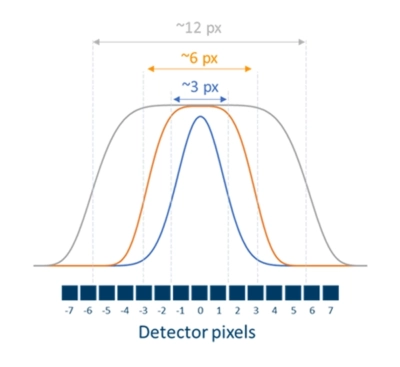
Figure 3: Spectrum of monochromatic input at increasing slit widths
Since the peak shape transitions from an approximately Gaussian profile at narrow slit widths to a flatter, top‑hat–like profile at wider slits, it is important to use an algorithm that can reliably extract the center wavelength and FWHM resolution for the specific peak shape encountered.
Pixel binning
The main principle of binning revolves around the summation of several adjacent pixel amplitudes into a so called “bin”, to simulate the performance of a wider pixel with an increased electron well depth. An illustration of this can be seen in Figure 4.
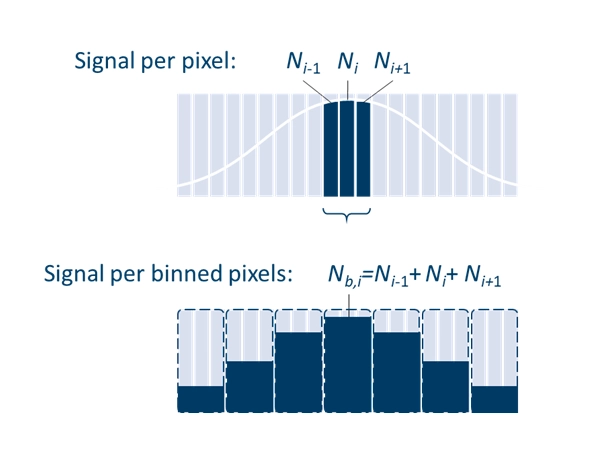
Figure 4: Pixel binning of a spectral profile
Hardware and software binning
There are two types of binning – hardware binning and software binning – which operate differently and affect SNR in slightly different ways. Hardware binning combines the charge from adjacent pixels directly on the detector chip before readout, whereas software binning sums the pixel values only after each pixel has been read out individually.
In the shot‑noise–limited regime, where read noise is negligible, both binning methods provide a similar improvement in SNR. However, in low‑light conditions where read noise becomes significant, hardware binning is advantageous because the combined signal is read only once, reducing the impact of read noise.
Hardware binning requires explicit support from the detector architecture, which is generally not available in the types of detectors commonly used in spectrometers.
SNR improvement by binning
When signals from adjacent pixels are combined, the total signal increases in direct proportion to the number of pixels included in the bin, since the signals simply add together. Noise sources however, add in quadrature, meaning the total noise grows only with the square root of the number of pixels. As a result, the signal increases faster than the noise, and the overall SNR improves by a factor of √N where N is the number of pixels in the bin.
An example of the SNR advantage provided by pixel binning is shown in Figure 5. A halogen lamp was used as the input source for a Compact ROCK VIS–NIR spectrometer equipped with a 70 µm slit and a 2048‑pixel Hamamatsu S11639 CMOS photodiode array with 14 µm pixel spacing. Fifty single‑shot measurements were acquired, and the mean amplitude and standard deviation of each pixel were used to calculate the SNR across the spectrum.
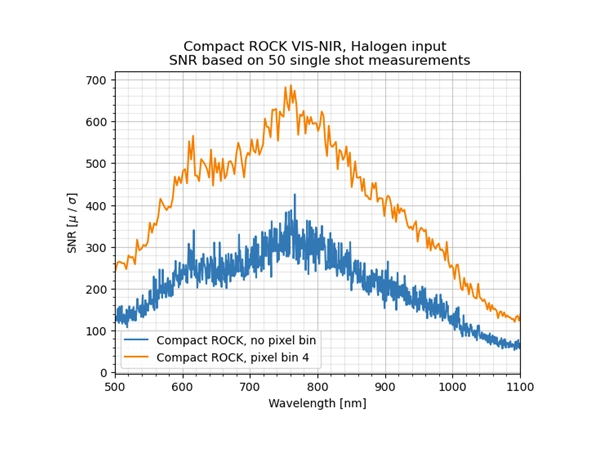
Figure 5: SNR improvement of halogen lamp spectrum when pixel binning
Binning 4 adjacent pixels across the central 1000 pixels of the photodiode array results in a spectrum which consists of 256 “super-pixels”, where the calculated SNR is increased by a factor of 2 which is exactly the square root of the binning size of 4. Note that this only holds true if the photon shot noise is considerably larger than the read and thermal noise of the detector, as mentioned previously.
Resolution impact by binning
As pixel binning averages the signal from neighboring pixels, the spectrometer effectively trades spatial sampling for improved SNR, resulting in a reduction in spectral resolution if the bin size becomes too large
As an example, Figure 6 shows the peak shape of an essentially monochromatic Cadmium emission line, allowing the intrinsic FWHM of the Compact ROCK VIS–NIR spectrometer’s resolution function to be observed directly. The slit width is 70 µm, and the spectrometer optics provide a magnification of approximately 1.1, producing a slit image on the detector that is about 77 µm wide. With a detector pixel pitch of 14 µm, the resulting resolution peak is sampled by roughly 5.5 pixels, consistent with the left‑hand plot in Figure 6. When four pixels are binned, the effective pixel width becomes 56 µm, reducing the sampling of the resolution peak to only 1.4 pixels. This is clearly below the commonly accepted requirement of at least 2–3 pixels across the FWHM. As shown in the right‑hand plot of Figure 6, the spectrometer can still resolve the single Cd line with only about a 14% deviation (1.6 versus 1.4 pixels). However, it would no longer be able to resolve two spectral lines separated by 1.4 pixels.
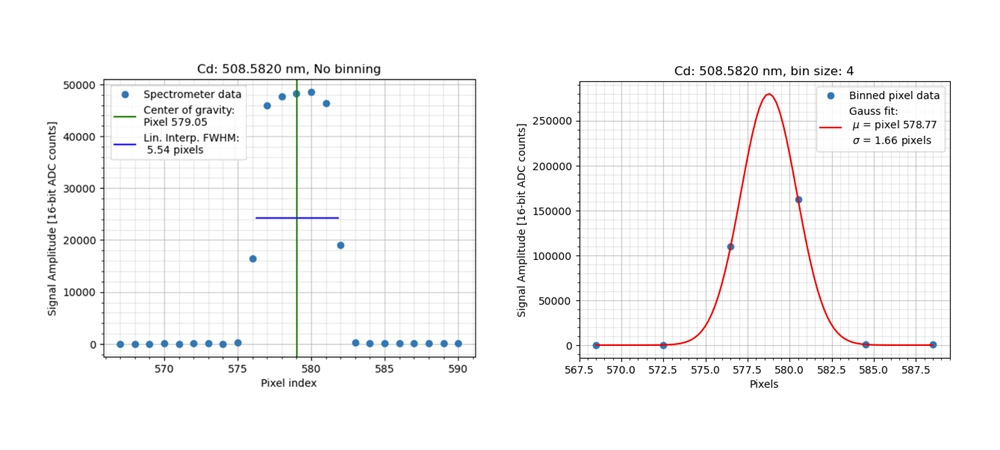
Figure 6: Monochromatic Cadmium spectral line resolved with and without pixel binning
Summary
Pixel binning can significantly improve the SNR of a spectrometer with a wide slit, provided that the detector’s pixel spacing oversamples the resolution FWHM. The optimal bin size is achieved when the effective width of the binned pixels remains two to three times smaller than the resolution FWHM; under these conditions, the SNR increases without degrading the spectral resolution.
When selecting an appropriate fitting algorithm for determining the center wavelength and FWHM, it is important to account for the actual peak shape, which reflects the image of the input slit and may deviate from a simple Gaussian profile.
At Ibsen Photonics, we have decades of experience optimizing binning strategies and spectral‑fitting algorithms for high‑performance spectrometers. Please contact us to ensure you unlock the full potential of your Ibsen spectrometer.
Want to know more?
For further information see below.