How to measure a full fluorescence spectrum
On this page, you can find examples of different fluorescence emission spectra measured using our PEBBLE VIS full spectrum spectrometer. Each fluorescence spectrum corresponds to a particular fluorophore. Many fluorometers measure only fluorescence at one wavelength whereas as spectrophotometer provides the full spectrum. Therefore, if you are measuring multiple fluorophores with complex spectra, it is a benefit to use a spectrophotometer since it is the fastest, most inexpensive, and most accurate tool to get full spectra. Scroll down to see the measurement set-up and a video of some live measurements.

Fluorescence Spectrum of Chlorophyll
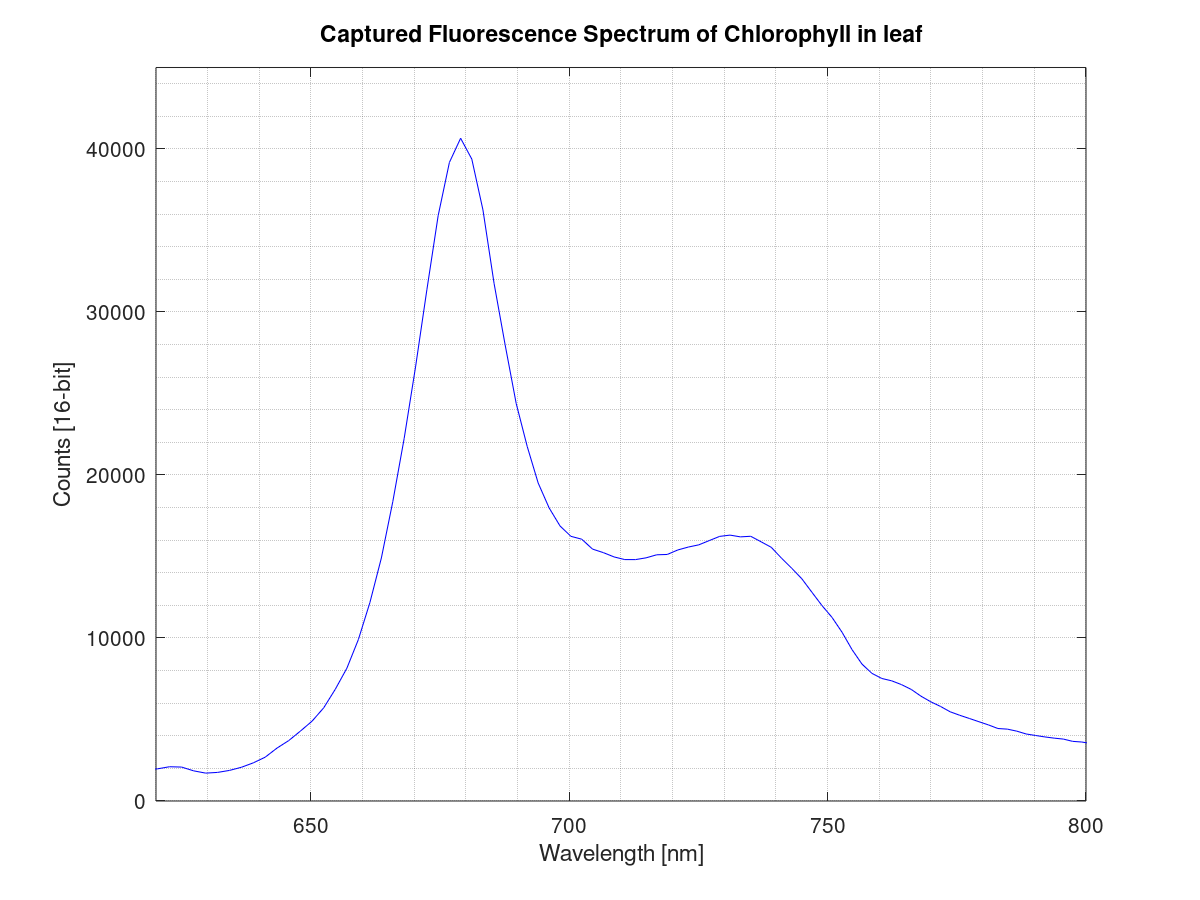
The fluorescent spectrum below is recorded with a white LED as a light source and a leaf from one of our office plants as a sample. The graph shows a nice chlorophyll fluorescence spectrum with a peak at 673 – 679 nm.

Fluid Fluorophores
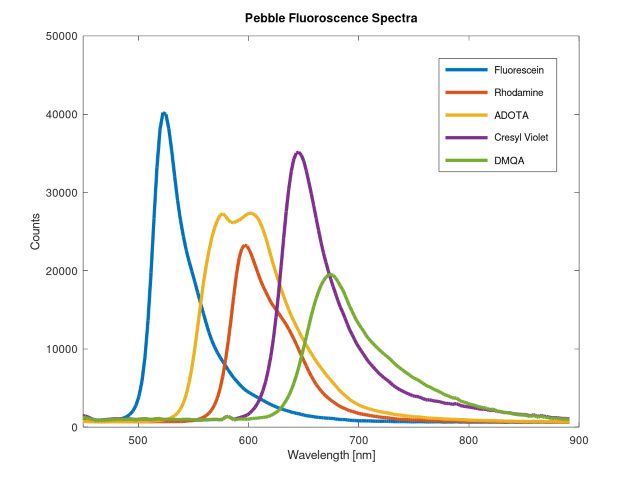
The following measurements have been obtained at The Department of Chemistry, Copenhagen University with the help of Dr. Thomas Just Sørensen. All measurements were captured using the PEBBLE VIS spectrometer connected to a fluorescence front-end optics with a 405 nm LED, a 455 nm short pass excitation filter, a 455 nm dichroic filter and a 466 nm Long Pass Emission filter. The integration time was around 100 msec for Fluorescein and Rhodamine, ADOTA and 500 msec for Cresyl Violet and DMQA.

Measurement set-up
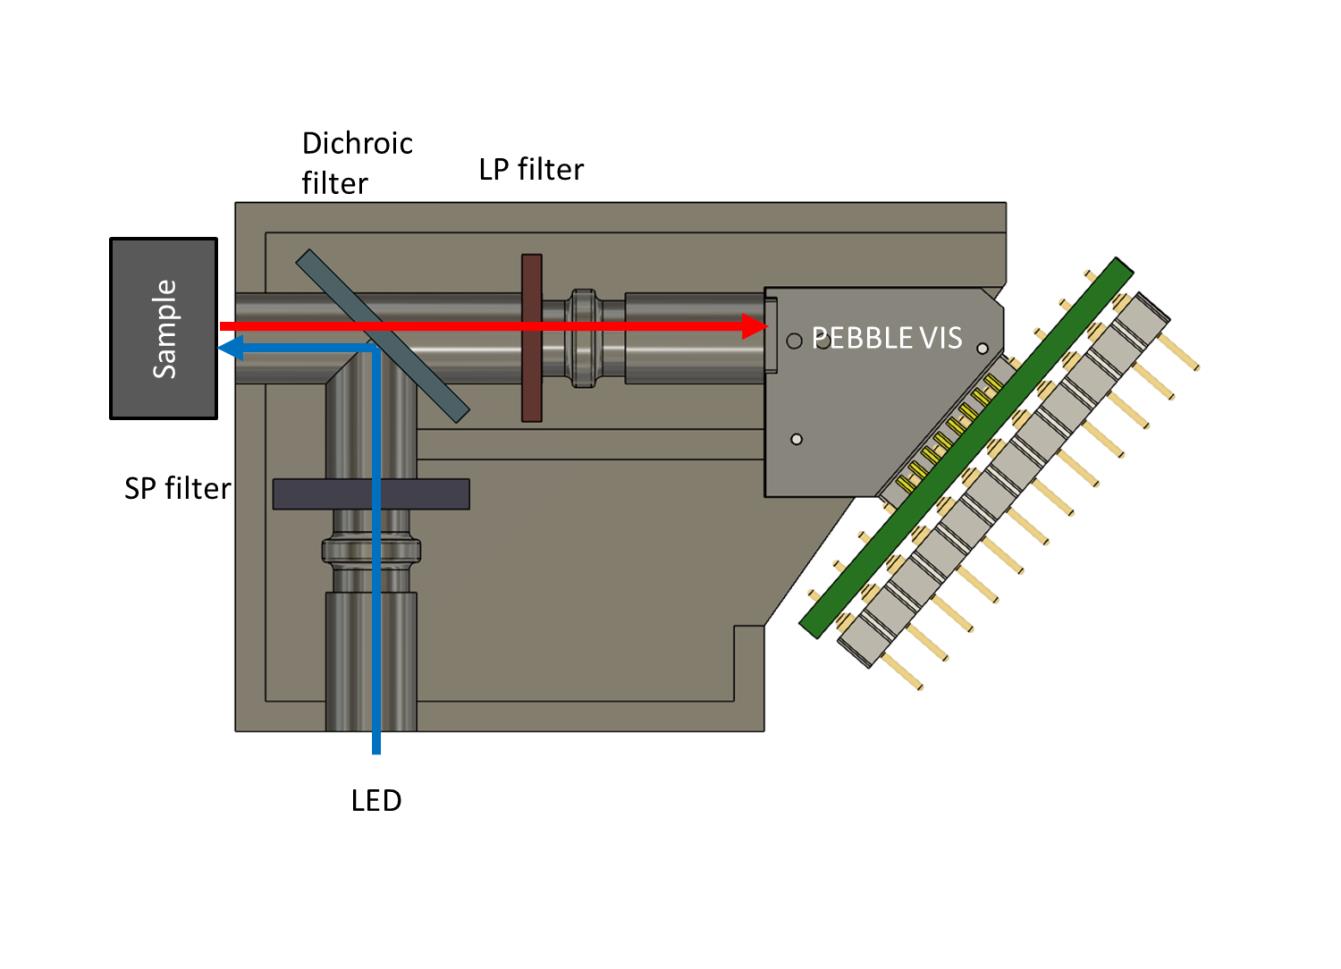
The set-up used to make the measurements is shown in the figure below. The excitation light from the LED is passed through a short pass (SP) filter and directed to the sample by a dichroic filter. The fluorescent light from the sample is passed through the dichroic filter and a long pass (LP) filter and detected by a PEBBLE VIS ultra compact spectrometer. This spectrophotometer covers 360 – 830 nm with a resolution of 6 nm. The wavelength range is sampled by 256 pixels.

Measuring Fluid Fluorophores with our PEBBLE Spectrometer
Want to know more?
For further information see below.