Noise in detectors for spectroscopy
Abstract
One of the most important goals in acquiring good spectroscopic data is getting the best signal-to-noise ratio. In this note, we review the factors that contribute to the noise theoretically and practically. We compare four often used detectors, the Sony ILX511B and the S11639, the S10420 and the S11156 from Hamamatsu on their SNR. These results can help you select the best detector for your application.
Introduction
Getting the best results for your application often relies on getting the best spectroscopic data. One of the most important measures that quantify the quality of your spectrum is the signal-to-noise ratio (SNR). In general, more signal leads to a better SNR. However pixel detectors such as CCD and CMOS linear array detectors have a maximum value they can put out above which they saturate. Moreover, many spectra have wide variations in signal strengths, one spectral peak might be 100 times stronger than the other and still you expect a good SNR at both intensities.
This technical note is intended to explain what determines the SNR of spectroscopic detectors and presents measurements of SNR factors of several often used detectors in spectroscopy. With this information it becomes easier to understand where different detectors differ and you will be able to evaluate which detector gives the most optimal performance for your application.
Detection basics
In a measurement with a linear array detector, the light impinging on the detector excites electrons. These electrons are integrated (accumulated) over the measurement time and stored in the pixel. Then, they are converted to a digital number using – often referred to as counts – an analog-to-digital converter (ADC). Below, this process is described in a bit more detail.
Linear array detectors as we discuss here are integrating devices. They accumulate the signal that is detected during the integration time that is chosen. The longer the integration time the higher the detected value. Figure 1 illustrates how a single pixel forms a well in which electrons can be stored. The electrons first have to be excited to end up in the well. Ideally this happens due to the absorption of a photon. Electrons can however also gain enough energy thermally (i.e. without any light impinging on the detector) to end up in the pixel, this is called the dark current.

Figure 1, Pixel well indicating its full well capacity and the photo and dark current.
The measurement
In general the measurement value (m) in counts has 3 contributions: the signal (s) caused by the light, the dark current (d) as was discussed above and the baseline (b).
Figure 2, shows these contributions to the measurement schematically.

Figure 2, sketch of the contributions of different sources to the measured value in ADC counts.
The signal is the part of the readout of the detector that is caused by light reaching the pixel on the detector. Each photon that hits the detector can generate one electron within the pixel. The efficiency with which this occurs is called the quantum efficiency (Q), it is often specified by the manufacturer of the detector and is highly dependent on the wavelength. A good detector can have a Q of 0.9 for a certain wavelength range. The signal level due to N photons on the detector is
where α is the conversion efficiency from electrons to counts which depends on the properties of the electronics such as the gain settings.
The second contribution to the value of m is the base level or offset b. This is a fixed value that is set by adding a voltage offset to the ADC. This offset is needed for the ADC to give sensible positive values and it has similar values in all pixels. A stable offset is of high importance to long term measurement series (many minutes) the short term noise on the offset is however very small.
Finally the dark current d is the signal that originates from the thermal excitation of electrons. Even without illumination a signal can be measured because electrons spontaneously can be captured in the pixels of the detector. This effect accumulates over time and is temperature dependent. The dark current is given by
where α is again the electron to counts conversion efficiency, β(Τ) is the temperature dependent dark current and t is the integration time. To minimize the dark signal, detectors are sometimes cooled (see also our Technical Note on cooled CCD detectors). Another way of reducing the dark current is by using short integration times and smaller pixel sizes.
The total measured value is given by
Only the signal s contains usable spectral information. It is therefore important to remove the contributions of the dark current and base-line. This is often done by subtracting a dark-spectrum: a spectrum collected without illumination. (See also our Technical Note on subtracting dark spectra)
Noise
The noise in the measurement m is the random fluctuations that occur over time. It is dependent on the noise in the separate contributions to the measurement plus the readout noise nread. Typically, we assume noise sources are independent and normally distributed and then we can add them using their squares

to obtain the total noise ntot.
The first noise source (nphot) is the noise in the photo-generated signal nphot. With this we mean the fundamental noise that a stable light source will have: the photon shot-noise. For reasonably large signals consisting of N photons on average during the integration time, the shot noise can be well approximated by a normal distribution with a width of the square root of QN. The total photo signal noise is given by
The second noise source (ndark) comes from the dark current. Also here shot noise is the fundamental limit, in this case the dark electron noise is given by the square root β(T)t and thus
The noise of the baseline nbase is more difficult to quantify and depends on the read-out electronics. In general it is very small over short time scales (<1 sec), however, on long time scales its drift can be a considerable factor. The best way to deal with the drift in the offset is to measure a non-illuminated spectrum (dark spectrum) with every illuminated spectrum to follow the changes of the bias level.
The final noise source is the read noise nread, which is a fixed noise, independent on the signal intensity, that is unavoidable in reading out the detector. This noise generally depends on the read out speed, where faster read out gives higher noise. Its value is often specified in electrons in the detector specification of manufacturers [1] so, in order to convert the read noise to counts you also have to multiply with α.
The total noise of the system is given by

where all noise sources are measured in counts.
Signal to noise ratio
Our main interest in this section is to know the signal-to-noise ratio (SNR) and to understand what determines this in theory. For this we first need to extract the signal from a measurement. To do this dark and bright measurements are always done in pairs and the signal s is given by s = mlight– mdark. In this way the contribution of dark current and baseline can be subtracted. Noise can however not be subtracted and therefore the noise on the retrieved signal is

The factors of 2 in this equation arise from the fact that we subtract two signals with independent noise sources. The signal to noise ratio is

Next we will consider 4 situations in which each of the noise sources is the dominant source of noise. For some detectors and circumstances these can be rather hypothetical circumstances but it is instructive to look at these situations nevertheless.
Firstly, let us consider a situation in which the signal noise is dominant. The SNR then becomes

This situation is applicable if the signal is much larger than the dark current. It is the situation in which the highest SNR values are found. Note that it rises with the square root of the number of photons.
If the read noise is dominant the SNR becomes

This can be the case if the signal is very weak and the dark current is negligible. For instance when the integration time is very short or you are using a deep cooled detector. Note that in this case the SNR rises linearly with the number of photons.
If the dark current noise is dominant the SNR becomes

For low signals and non-cooled detectors the dark current noise can be limiting SNR.
Finally, if the bias noise is dominant:

This is actually an unlikely case. It will only occur if the bias is very noisy due to an electronic malfunction or if you are systematically taking dark reference measurements at completely different times than the light measurement. The bias is more likely to give rise to issues due to a long term drift (See also our Technical Note on dark spectrum subtraction)
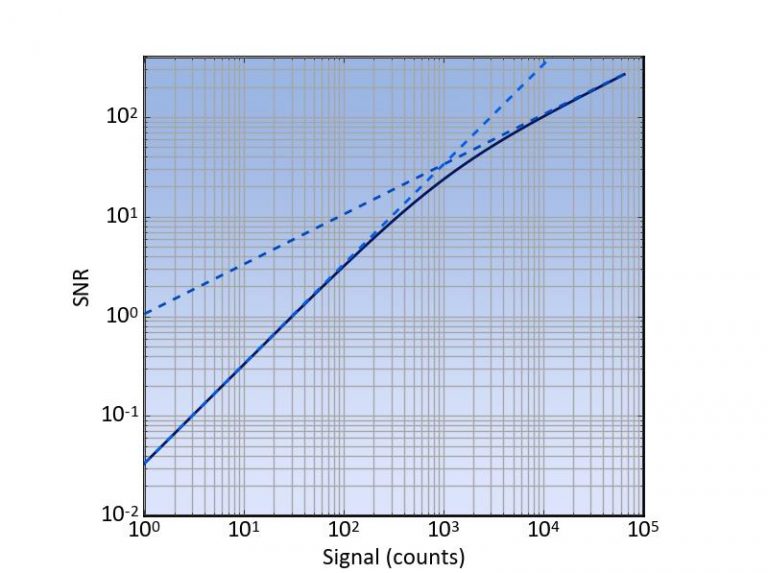
To give a small example of the SNR of a detector Figure 3 shows the theoretical curve of a detector with only read noise and shot noise.

Figure 3, SNR versus signal of a typical detector given in black. The two dashed curves give the limiting behavior. At high counts the shot-noise limit (α=0.9) and at low counts the read noise limit (nread=30 counts)
It is instructive to plot the SNR versus the signal level in counts on a double logarithmic scale as this clear shows the two limiting cases – the shot noise limit and the read noise limit. The plotted relationship is

Where the shot noise is described as a function of the signal. Thus, in the shot noise limited case this becomes
Which has a slope of ½ on a double logarithmic scale, whereas the read noise limited region has a slope of one:

Practical examples of SNR
In this section we present measurements of the SNR of four commonly used detectors. These are the Sony ILX511B, and the Hamamatsu S11156, S11639 and S10420. Table 1 summarizes some of the relevant technical specifications of the tested detectors and some of the test results.
Table 1, summary of technical specifications of the tested detectors
| Technology | Pixel size (µm) | Full well depth (ke) | Measured read noise (counts) | Measured α (cnts/electron) | Max SNR | |
|---|---|---|---|---|---|---|
| S11639 | CMOS | 14 x 200 | 80 | 26 | 0.48 | 360 |
| S10420 | CCD | 14 x 896 | 300 | 16 | 0.26 | 475 |
| S11156-01 | CCD | 14 x 1000 | 200 | 21 | 0.41 | 390 |
| SonyILX511B | CCD | 14 x 200 | 63 | 53 | 1.5 | 215 |
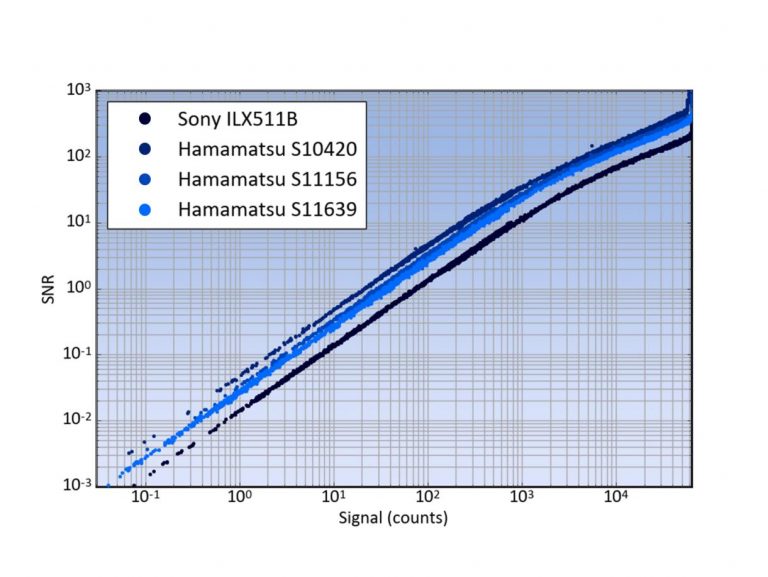
To measure the SNR, 600 spectra are measured with the light on and 600 with the light off using 2 ms integration times. The gain settings of each detector were optimized for best SNR performance (see Appendix 1 for details). The spectra were subtracted pair by pair to obtain the signal and the standard deviations of these baseline corrected spectra were used to obtain the noise. Care was taken not to include measurements just after powering on the spectrometer to avoid drift. The SNR curves for the four detectors are displayed in Figure 4. All 4 have the same characteristic behavior where regions of read noise dominated and signal dominate noise are clearly visible.

Figure 4, SNR versus signal for 4 commonly used detectors
The measurements were done using typical detectors and the results can be considered representative. Some care has to be taken however as detectors can show unit-to-unit variation in read noise. (See the technical specifications of manufacturers [1]). As can be seen the best SNR is found for the S10420 detector, followed by the S11156 and the S11639.
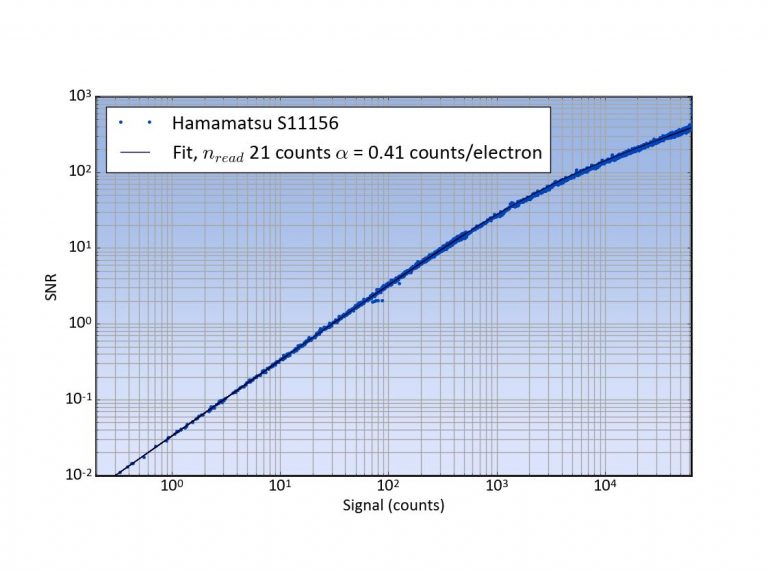
It is interesting to compare theory and experiment. To do this, to each of the results presented in Figure 4 the theoretical prediction on SNR

is fitted. We thus neglect the noise contributions by the base level and dark current as these are very small especially with the short 2 ms integration time used. Figure 5 shows the result of the fit for the S11156 detector. Clearly the theory gives an excellent description. The extracted parameters are the read noise which turns out to be 21 counts (approximately 9 electrons) and the counts per electron α=0.41.

Figure 5, SNR of the Hamamatsu S11156 with fitted theoretical relationship.
Conclusion
In conclusion, we have made a measurement of the SNR of 4 commonly used detectors for spectroscopy. Their behavior is shown to be well described by simple theory. The two most important factors at short integration time, being the read noise and the shot noise, were quantified.
The results, especially those summarized in Table 1 can be used to select the detector for your spectroscopic application. Of course these SNR figures are only part of that process as cost and quantum efficiency are important additional factors. Moreover it should be realized that the throughput of spectrometers equipped with detectors with higher pixels (such as the S11156) is generally higher. Having higher throughput can again mean that shorter integration times could be used and that several measurements can be averaged to improve SNR.
References
[1] The Hamamatsu spec sheets can be downloaded from the Hamamatsu website
Appendix 1: Gain settings
The detectors used for the tests in this document were read out with electronics that allowed the gain and offset voltage before the ADC to be adjusted. Also the ADC range could be set to either 2 or 4 Volt. For each detector the settings were optimized to get the best SNR and also have a linear behavior with less than 5% deviation of the linear slope. The table below gives the gain values used.
| Gain | ADV Voltage (V) | Ibsen SN | |
|---|---|---|---|
| S11639 | 2.4 | 4 | 035689 |
| S10420 | 1.4 | 4 | 036231 |
| S11156-01 | 1.0 | 4 | 035918 |
| SonyILX511B | 1.9 | 2 | 036012 |
Want to know more?
For further information see below.